Fig. 5.
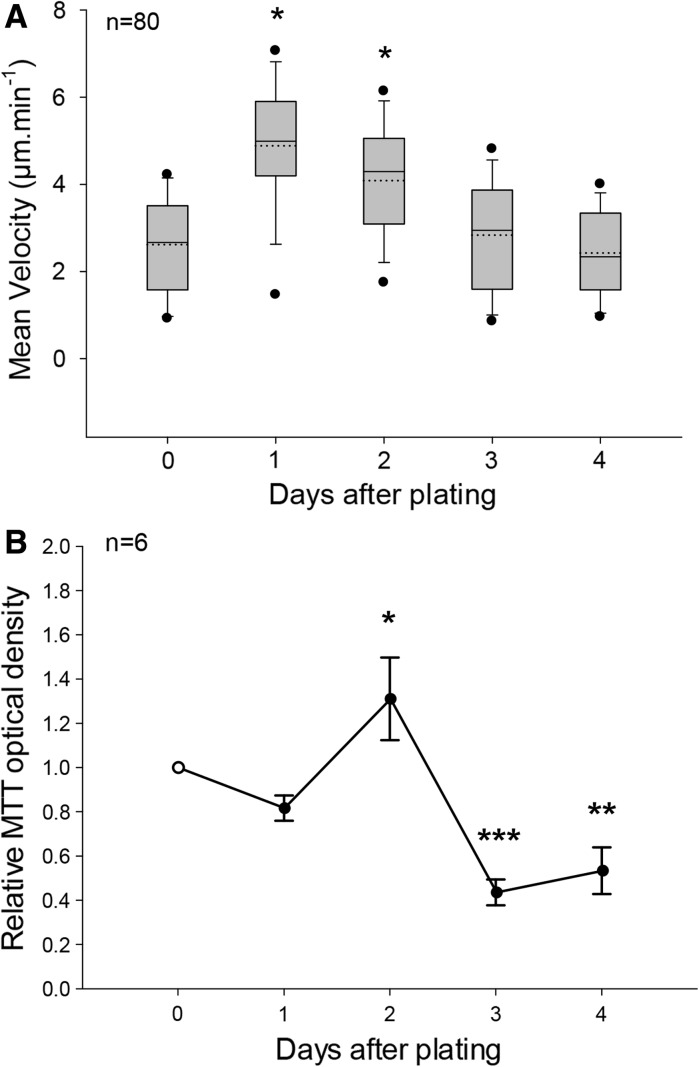
Evolution of hemocyte velocity and mitochondrial metabolic rate in vitro. a Mean velocities were computed from migration distances recorded during 30-min time-lapse nuclei tracking in the culture dish after Hoechst 33342 staining. In 4 replicated cell cultures obtained from individuals, mean cell velocities were determined from 20 trajectories at days 0, 1, 2, 3 and 4 and plotted in a box chart. Box boundaries indicate the 25th (bottom) and the 75th (top) percentiles. A solid line within the box marks the median, and a dashed line the mean. Whiskers below and above the box indicate the 10th/90th percentiles. Outlying points show the 5th/95th percentiles. Velocities significantly different from value at day 0 are indicated (*p < 0.05, Kuskal-Wallis ANOVA on ranks, Tukey post hoc). b Changes in MTT responses of cultured hemocytes over time, expressed as a ratio ± SEM (n = 6) relative to seeding values at day 0 (open circle). MTT OD significantly different from value at day 0 are indicated (*p < 0.05, **p < 0.01, ***p < 0.001, one-way ANOVA, Holm-Sidak post hoc)

