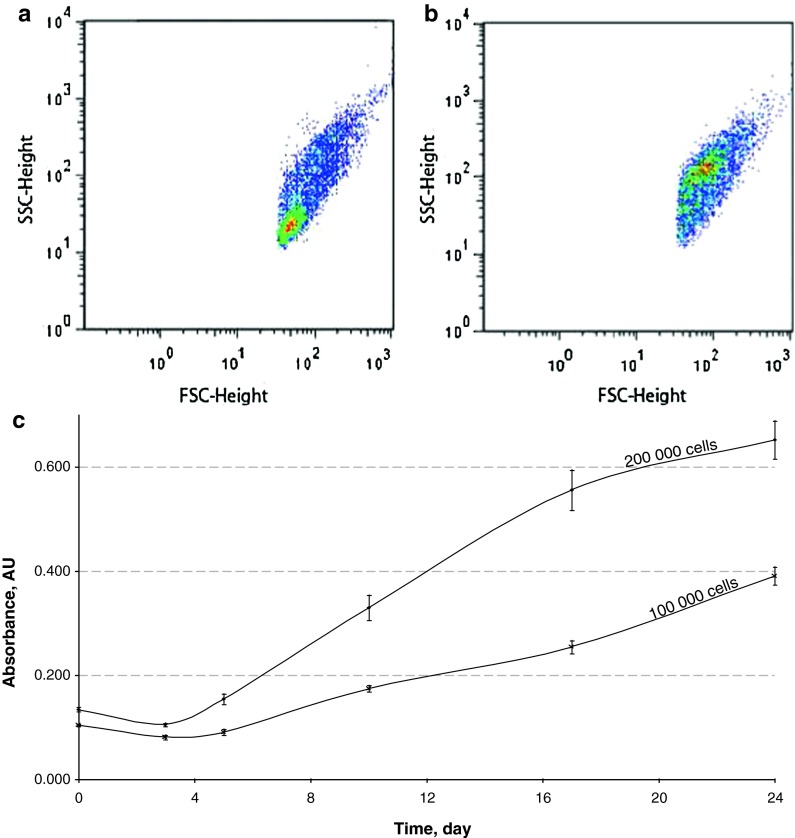
Fig. 2.
Flow cytometry analysis and mitochondrial activity of gill cells of H. tuberculata. Characteristics of cell populations of freshly mechanically dissociated gill (a) and gill cells after 3 days in subculture (b), size (FSC) against internal complexity (SSC) density plot representation, after 30 min of incubation with SYBR Green. (c) Evolution of the XTT response of gill cells in subculture at two densities: 100,000 and 200,000 cells/well in 96-well microplates. Data are the mean ± SE of ten values expressed as OD 490/655 nm

