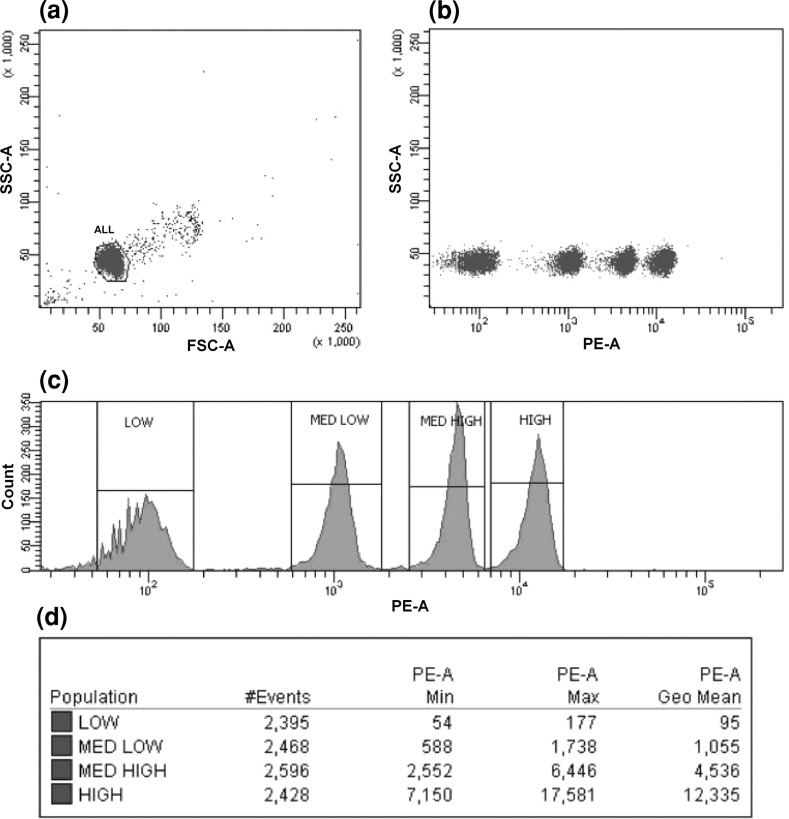
Fig. 1.
Analysis of QuantiBRITE PE calibration beads. a Gate around the bead singlet on a dot plot of FSC versus SSC. b The bead singlets on a dot plot of PE versus SSC. c PE-associated fluorescence histogram of log values for the singlet bead populations. Interval gates were adjusted around the each of four bead peaks (Low, Med Low, Med High, High). d Statistics

