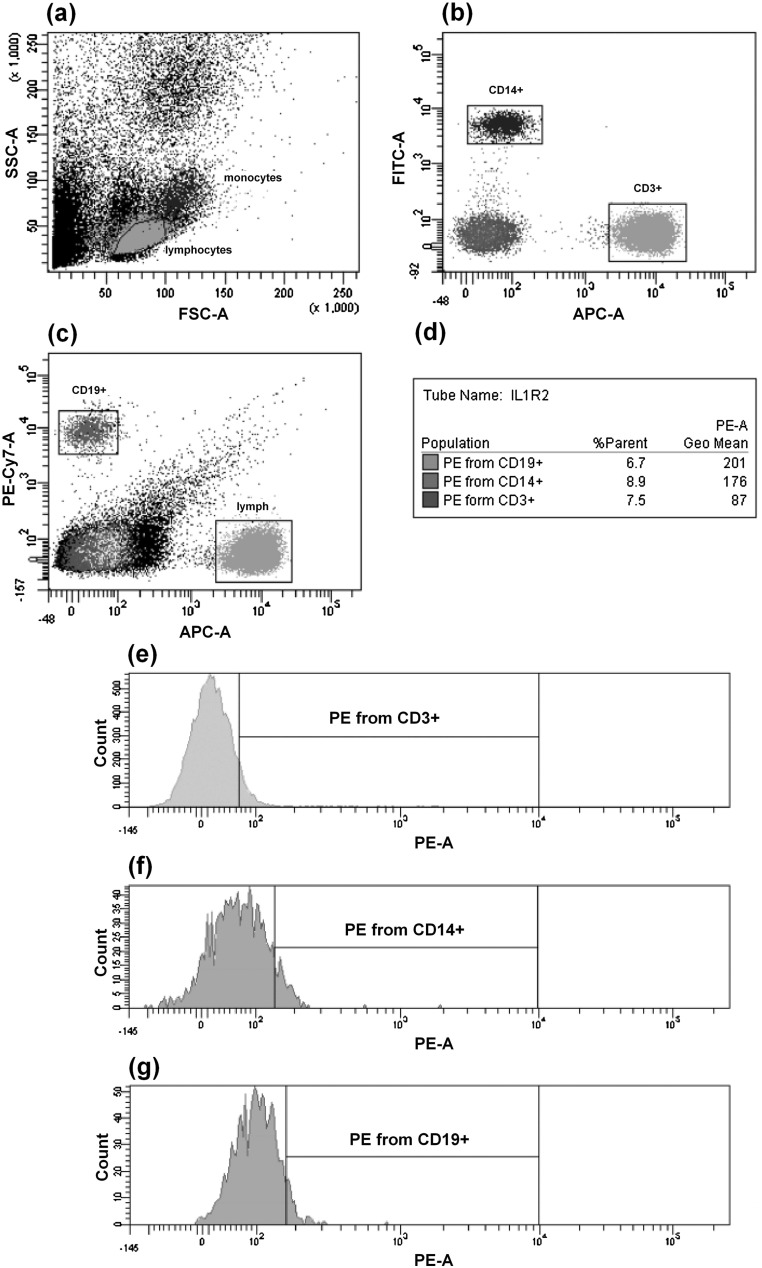
Fig. 3.
Dot plots and histograms representing a standard gating protocol. a Gates around lymphocytes and monocytes on an FSC versus SSC dot plot. b Gates around CD3+ and CD14+ cells on an APC CD3 versus FITC CD14 dot plot. c Gates around CD3+ and CD19+ cells on an APC CD3 versus PE-Cy7 CD19 dot plot. d Statistical analysis. e Histogram of IL-1RII PE from CD3+ T lymphocytes. f Histogram of IL-1RII PE from CD14+ monocytes. g Histogram of IL-1RII PE from CD19+ B lymphocytes. Interval gates were adjusted using isotype control sample

