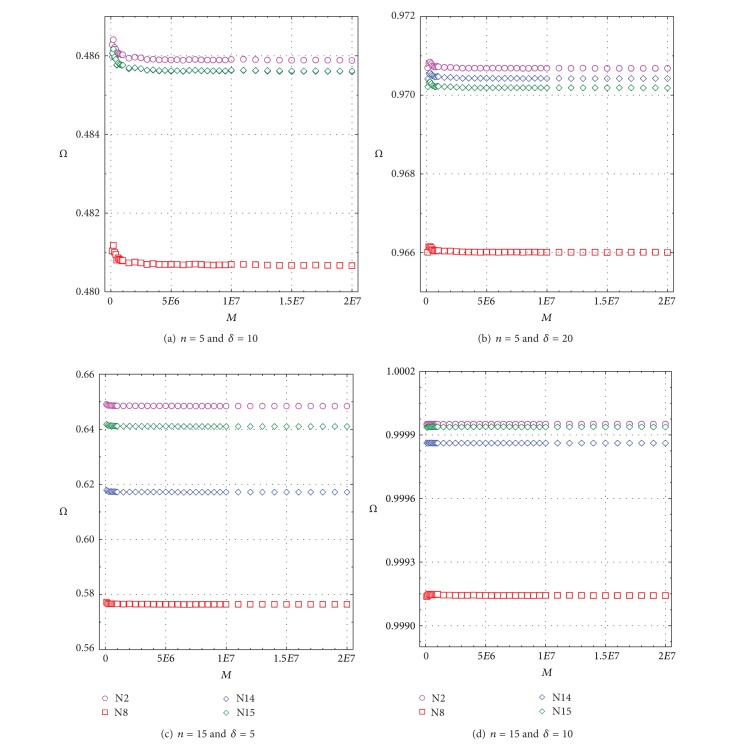
Figure 2.
Determination of optimum simulation replication (M) for Power of Test (Ω) as a function of replications for all tests N2, N8, N14, and N15; symbols are explained in each figure. (a) Sample size n = 5 and contaminant parameter δ = 10; (b) n = 5 and δ = 20; (c) n = 15 and δ = 5; and (d) n = 15 and δ = 10.

