Figure 2.
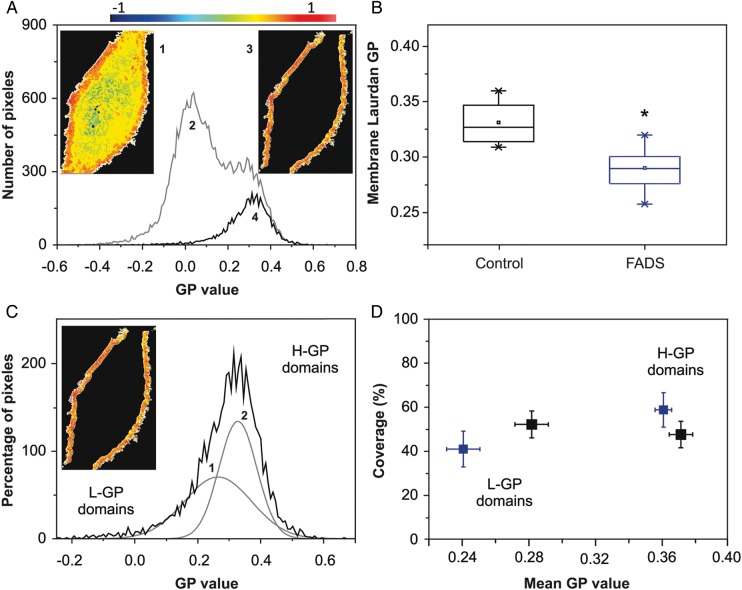
PM organization (Laurdan GP imaging) (A) Average Laurdan GP value for the PM is obtained from the GP image (1) taken at the middle plane of the cell. In the pixel distribution (2) the pixels corresponding to the membrane (3) were isolated for analysis (4). (B) Average membrane GP values from control and FADS cells. Box charts showed minimum, median, 25th, and 75th percentile values. *P<0.05. (C) Pixels distribution from the PM (image inserted) is deconvoluted into two best-fitted Gaussians and the area and main GP value of each Gaussian distribution are obtained. (D) Double plot where the center of each Gaussian (main GP value) and the area (% coverage) was represented for 15 cells. All measurements were performed at 37°C. Black and blue plots represented control and FADS cells, respectively.

