
Figure 4.
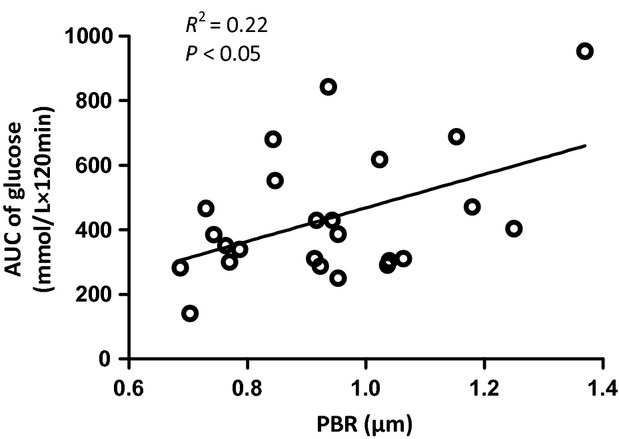
Relation between PBR and AUC of glucose. Relation between the PBR measured at baseline (X‐axis) and the corresponding AUC of glucose measured during the IPGTT (Y‐axis) for all individual experiments in this study in which both PBR and AUC glucose for 120 min were obtained. Correlation analysis revealed a R2 of 0.22 (P < 0.05).