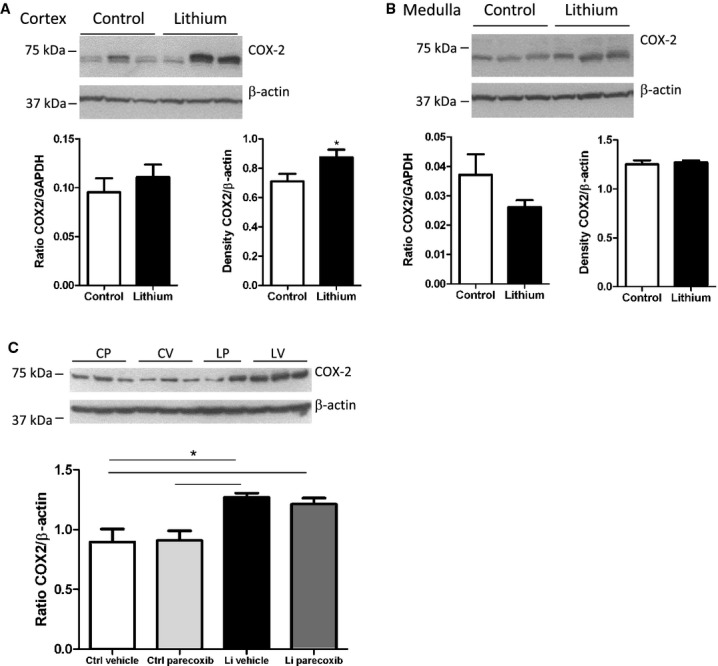
Figure 1.

Effect of lithium treatment on COX‐2 mRNA and protein level. (A) Effect of lithium treatment through postnatal days 7–28 on kidney cortex COX‐2 mRNA level (left panel) and cortex COX‐2 protein abundance (right panel and immunoblottings shown above). Values are mean ± SEM, * P < 0.05 (n = 6 for control, n = 12 for lithium treatment). (B) Effect of lithium treatment P7–P28 on kidney medulla COX‐2 mRNA level (left panel) and COX‐2 protein abundance (right panel, immunoblottings shown above). Values are mean ± SEM, * P < 0.05 (n = 6 for control, n = 12 for lithium treatment). (C) Protein abundance of COX‐2 in kidney cortex as assessed by western blotting of tissue from rats treated with vehicle (control‐vehicle, CV); parecoxib, 5 mg/kg per day (control‐parecoxib, CP); lithium and vehicle (Li‐vehicle, LV); and lithium and parecoxib, 5 mg/kg per day (Li‐parecoxib, LP). Data are presented as means ± SEM, *P < 0.05; n = 5 in all groups.
