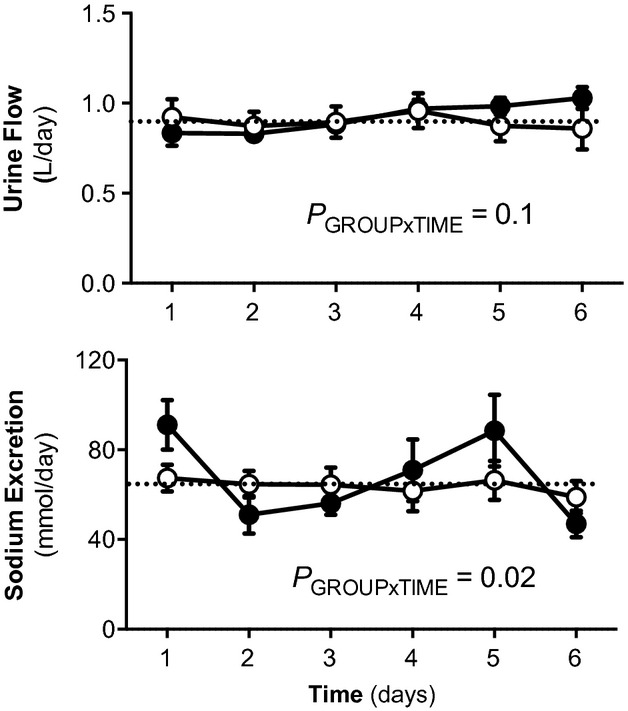
Figure 1.

Daily (24‐h) urine output and urinary sodium excretion in sham and uni‐x sheep at 5 years of age. Variables (mean ± SEM) measured for 6 days in 5‐year‐old sham (n = 7; open circles) and uni‐x (closed circles; n = 7) meal‐fed female sheep. The dotted line represents the average value for that variable in the sham sheep. P value represents the interaction term from a repeated measures ANOVA with factors group (sham or uni‐x) and time.
