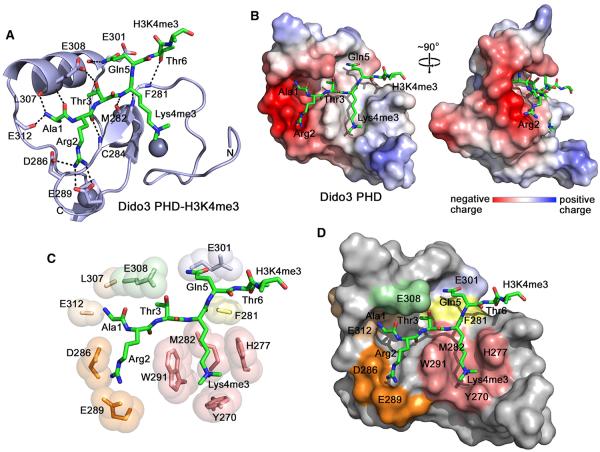
Figure 3. The Crystal Structure of the PHD Finger of Dido3 in Complex with the H3K4me3 Peptide.
(A) The ribbon diagram of the PHD finger. The H3K4me3 peptide is shown in a stick model. Dashed lines represent intermolecular hydrogen bonds. For clarity, here and throughout the text, individual residues of the PHD finger are denoted using a single-letter code, whereas individual residues of the histone peptide are denoted using a three-letter code.
(B) The electrostatic surface potential of Dido3 PHD is colored blue and red for positive and negative charges, respectively.
(C) A zoom-in view of the H3K4me3 binding pocket.
(D) The Dido3 PHD finger is depicted as a solid surface with the peptide shown in a stick model. The protein residues involved in the interactions with Ala1, Arg2, Thr3, Lys4me3, Gln5, and Thr6 of the peptide are colored wheat, orange, light green, salmon, light blue, and yellow, respectively.
See also Figure S3.

