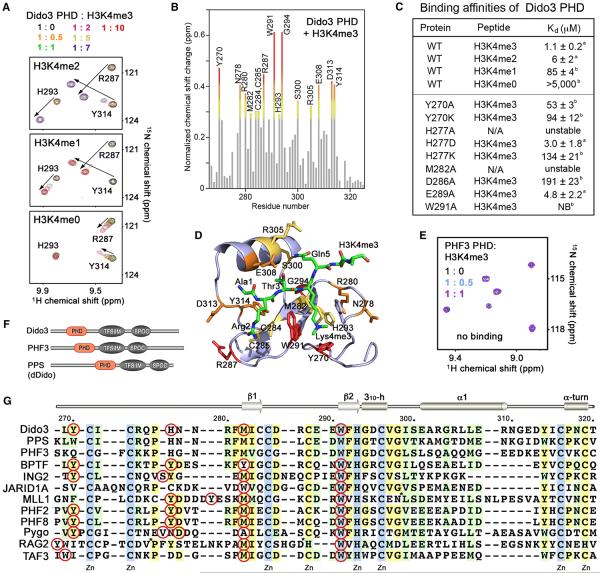
Figure 4. The Molecular Basis for H3K4me3 Recognition by Dido3 PHD.
(A) Superimposed 1H, 15N HSQC spectra of Dido3 PHD collected upon titration with H3K4me2 and H3K4me1 peptides (residues 1–12 of H3), as well as H3K4me0 (residues 1–19 of H3). Spectra are color coded according to the protein:peptide molar ratio.
(B) The normalized chemical-shift changes observed in 1H, 15N HSQC spectra of the PHD finger (depicted in Figure 2C) as a function of residue. Residues showing large chemical-shift differences are labeled. Differences greater than the average plus one and one-half SD, the average plus one SD, and the average plus one-half SD are shown in red, orange, and yellow, respectively.
(C) Binding affinities of wild-type (WT) and mutated Dido3 PHD for the indicated histone peptides measured by tryptophan fluorescence (A) or NMR (B). NB, no binding.
(D) The residues of the Dido3 PHD finger, most perturbed due to the interaction with H3K4me3, are labeled and colored as in (B).
(E) Superimposed 1H, 15N HSQC spectra of PHF3 PHD recorded as H3K4me3 peptide was titrated in.
(F) Architecture of the Dido/PHF3/PPS family.
(G) Alignment of PHD finger sequences: absolutely, moderately, and weakly conserved residues are colored light blue, pale yellow, and light green, respectively. The aromatic cage residues are indicated by red circles. Each tenth residue of Dido3 is labeled. Secondary structure elements of Dido3 PHD are shown on the top. For simplicity, eight residues in MLL1 and seven residues in RAG2 are deleted, as indicated by asterisks.

