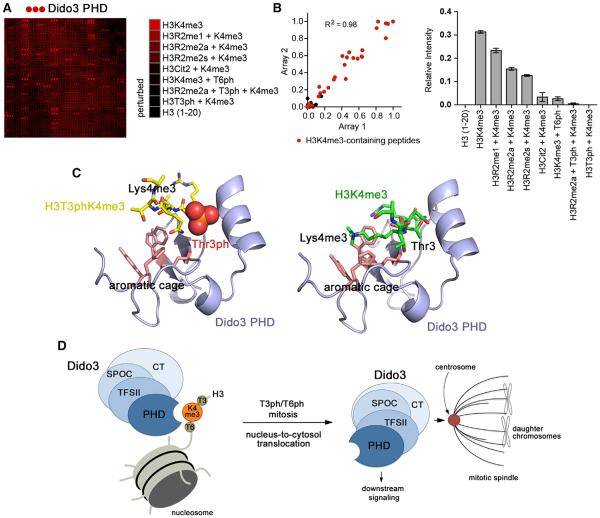
Figure 5. Phosphorylation of H3T3 or H3T6 Abolishes Binding to H3K4me3.
(A) GST-Dido3 PHD was hybridized to a histone peptide microarray. Red spots indicate binding of Dido3 PHD to various H3K4me3 peptides. The complete list of singly and multiply modified peptides used in the microarray is shown in Table S1.
(B) Left: scatterplot of two arrays probed with Dido3 PHD. Red dots indicate H3K4me3-containing peptides. The correlation coefficient was calculated by linear regression analysis using GraphPad Prism v5. Right: relative average signal intensities for peptide microarrays probed with Dido3 PHD. Error bars represent SEM from pooled averages of two independent array experiments.
(C) Modeling of the Dido3 PHD-H3T3phK4me3 and Dido3 PHD-H3K4me3 complexes using HADDOCK. The lowest energy structures from the top clusters are shown.
(D) A model for Dido3 translocation from chromatin to the mitotic spindle in mitosis.
See also Figure S4.

