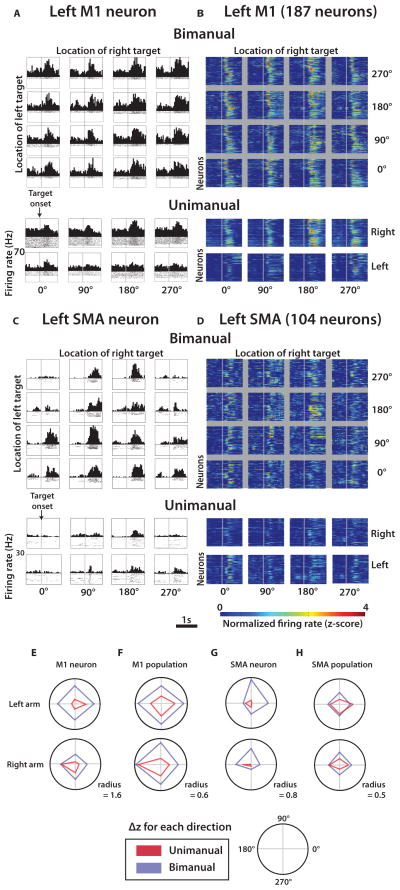
Fig. 3. Modulations of cortical neurons during manually performed unimanual and bimanual movements.
(A) Representative left M1 neuron peri-event time histogram (PETH) aligned on target appearance (grey line) for each of 16 left and right target location combinations during bimanual movements. Below the 4×4 grid are corresponding PETHs for the same neuron during unimanual trials in each of the four directions. (B) Same layout as (A) for the population of left M1 neurons. Each row of each color plot panel represents a single neuron and the pixel color is the normalized firing rate or z-score (color scale at bottom). (C–D) Representative neuron (C) and neuronal population (D) in the supplementary motor area (SMA) brain region. (E–H) for each of the four movement directions for unimanual (red) and bimanual (blue) trials for the left (top) and right (bottom) arms: for one M1 neuron (E), for a population of M1 neurons (F), for one SMA neuron (G), and for a population of SMA neurons (H).

