
Figure 3.
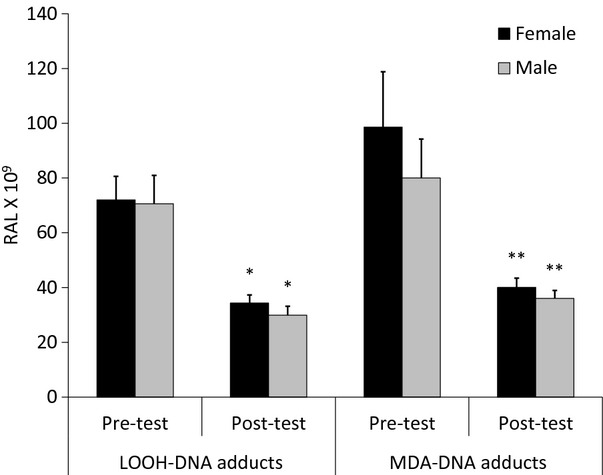
Lipid peroxidation–derived DNA adduct levels, by gender, in the 29.5-mL noni juice dose group. *P < 0.0001 compared with pretest values. **P ≤ 0.002 compared with pretest values.
Official websites use .gov
A
.gov website belongs to an official
government organization in the United States.
Secure .gov websites use HTTPS
A lock (
) or https:// means you've safely
connected to the .gov website. Share sensitive
information only on official, secure websites.
Lipid peroxidation–derived DNA adduct levels, by gender, in the 29.5-mL noni juice dose group. *P < 0.0001 compared with pretest values. **P ≤ 0.002 compared with pretest values.