Figure 1.
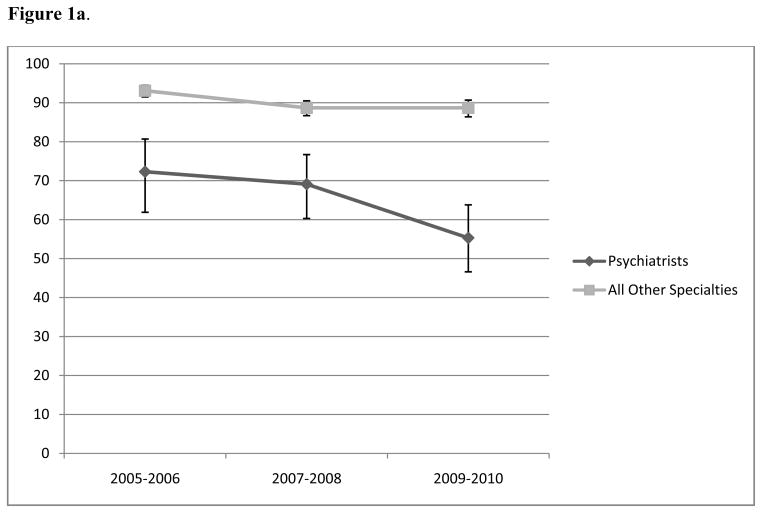
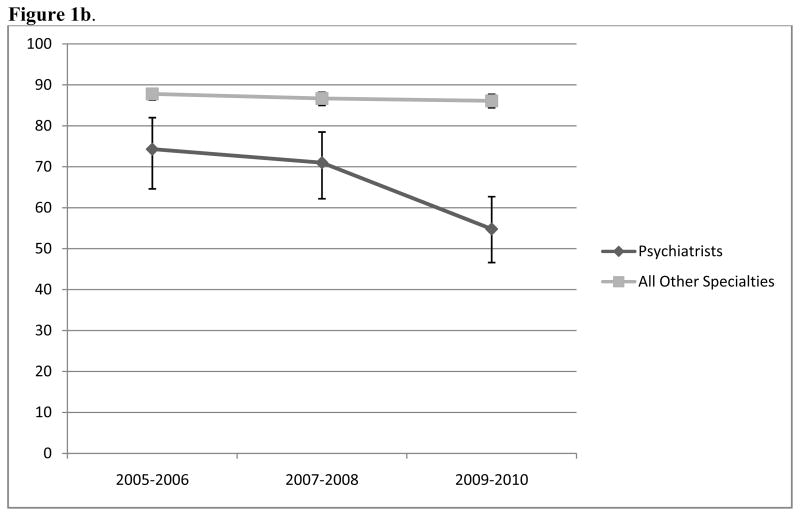
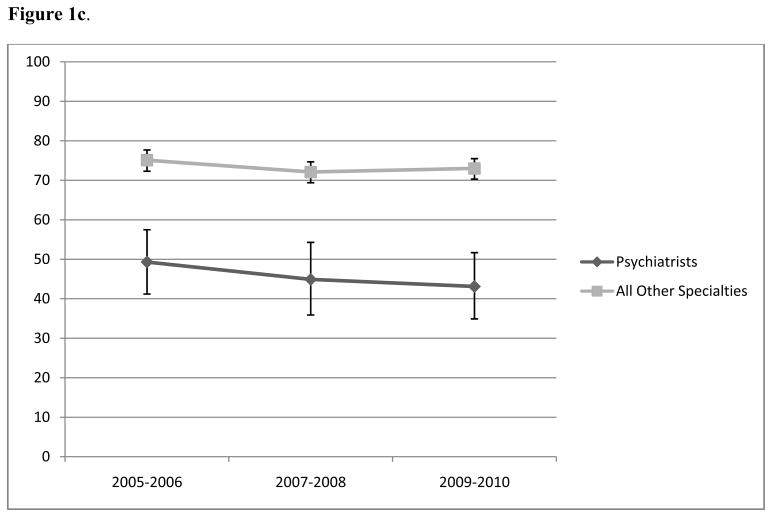
shows the percentage of office-based psychiatrists who accept various forms of insurance between the years 2005-2010.
Figure 1a. Percentage of office-based physicians who accepted private non-capitated insurance, 2005–2010a,b,c
a survey-weighted percentages based on the sample that was surveyed
b sample includes only physicians who accepted new patients in each study year
c p=0.01 for trend across years for psychiatrists, p<0.001 for trend across years for all other specialties
Figure 1b. Percentage of office-based psychiatrists who accepted Medicare, 2005–2010a,b,c
a survey-weighted percentages based on the sample that was surveyed
b sample includes only physicians who accepted new patients in each study year and exclude pediatricians
c p<0.001 for trend across years for psychiatrists, p=0.14 for trend across years for all other specialties
Figure 1c. Percentage of office-based psychiatrists who accepted Medicaid, 2005–2010 a,b,c
a survey-weighted percentages based on the sample that was surveyed
b sample includes only physicians who accepted new patients in each study year
c p=0.29 for trend across years for psychiatrists, p=0.25 for trend across years for all other specialties


