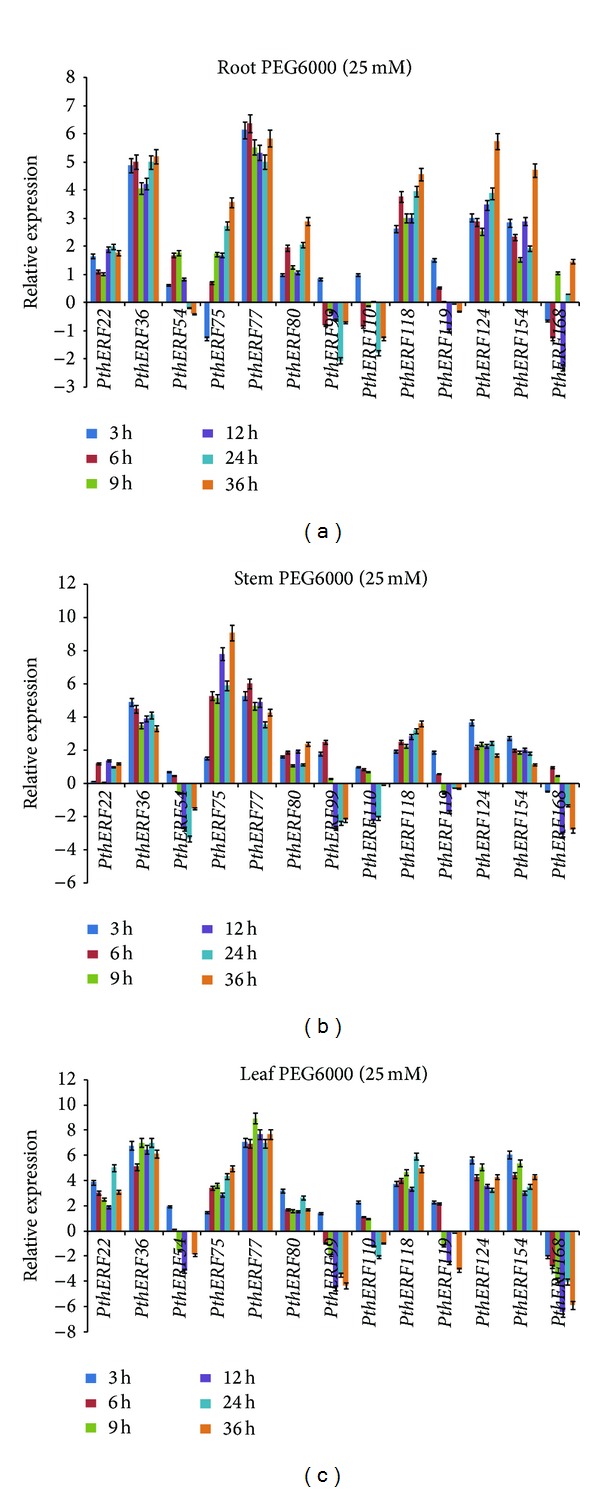
Figure 4.

Spatial-temporal expression of 13 PthERFs under drought stress in different tissues. Relative expression level was log2 transformed: >0, upregulation; =0, no change in regulation; <0, downregulation: (a) in roots; (b) in stems; (c) in leaves.
