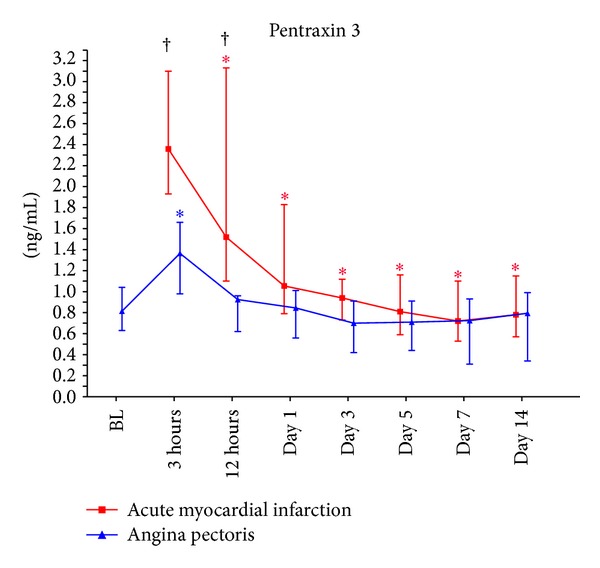
Figure 1.

The time profile of circulating PTX3 levels. BL: baseline; † P < 0.05 for between-group differences at the various time points; *P < 0.05 for intragroup differences from baseline in the angina pectoris group and from time point 3 hours in the acute myocardial infraction group.
