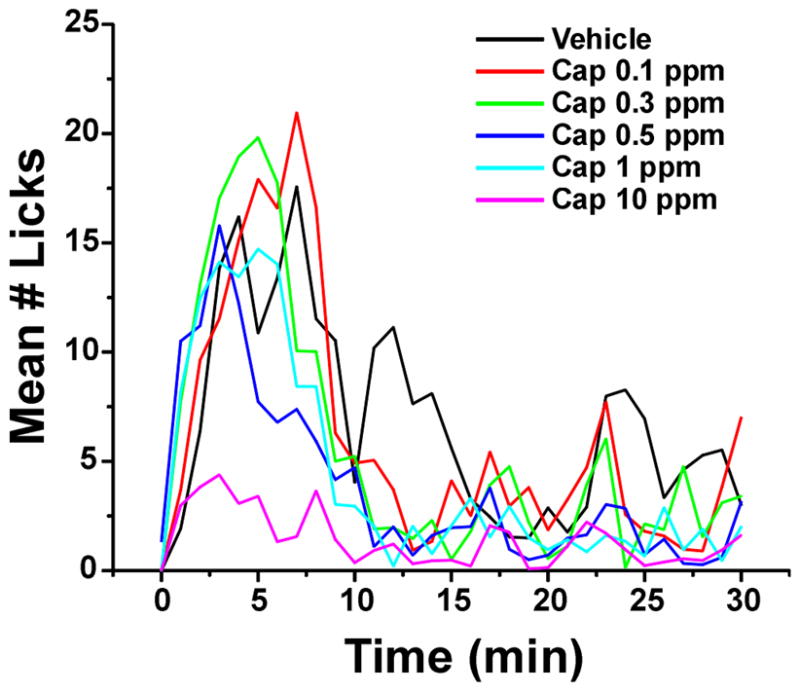
Fig. 2.

Pre-surgery microstructure of drinking bouts. Graph plots mean lick counts/ min during initial 30 min of exposure; each capsaicin concentration is indicated by a different color. Lick counts directed to the capsaicin-treated side were averaged (n= 35) over 2 days with bottle positions switched daily.
