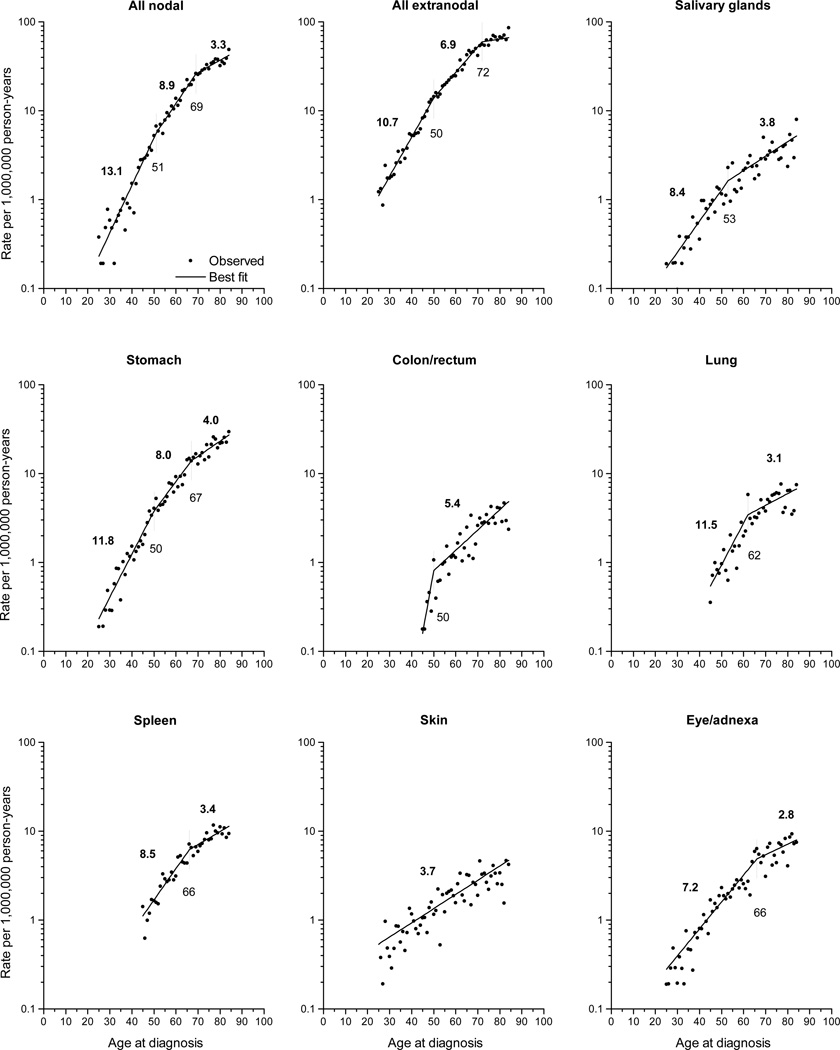
Fig 1.
Observed age-specific incidence rates of marginal zone lymphoma diagnosed in SEER-18 during 2001–2009 according to site by single year of age and predicted curve from the best fitting joinpoint model. Each significant slope (measured by the percent change per year of advancing age) is indicated above each fitted line segment, and age at each inflection point (joinpoint) is indicated below the respective vertical line.

