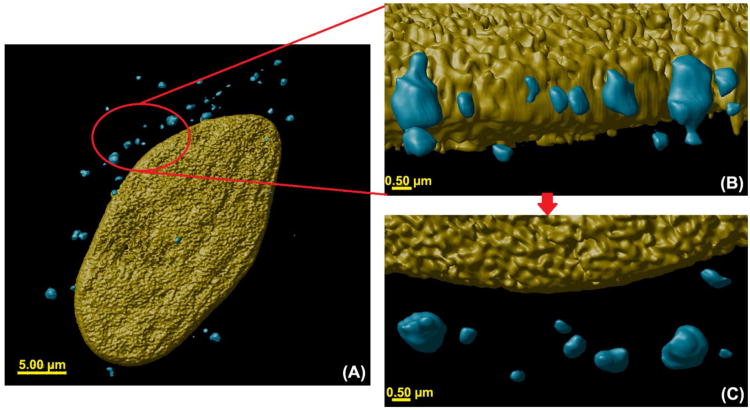
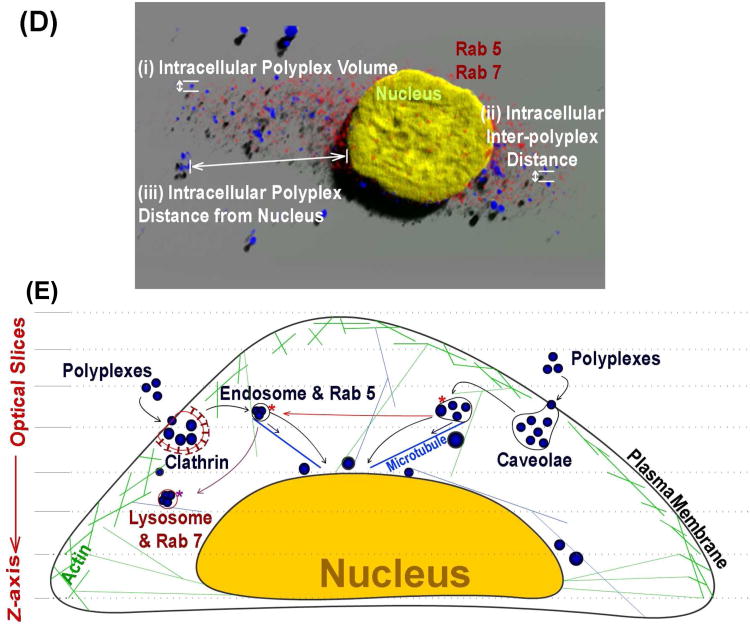
Figure 1.
Three-dimensional (3D) volume rendering of polyplexes comprised of Tr455 polymer complexed with FITC-pDNA fluorescence (pseudo colored in blue) and a HeLa cell nucleus labeled with DAPI (pseudo colored in yellow) at 24 hours post transfection. (A) Zoomed out view of a single cell showing the nucleus (pseudo colored yellow) and polyplexes (pseudo colored blue). (B) A close-up view of the indicated part of the cell from ‘A’. Various globular morphologies of the polyplexes can be observed near the nucleus. (C) A ‘top view’ of the polyplexes shown in ‘C’. (D) Illustration of the polyplex confocal imaging parameters studied herein with the 4D imaging techniques. (E) The intracellular mechanisms studied herein with the polyplexes: (i) intracellular polyplex volume; (ii) intracellular inter-polyplex distance and (iii) intracellular polyplex distance from the nucleus. Also, analysis was performed to study 3D colocalization of polyplexes with intracellular organelles such as (i) endosomes (Rab 5), (ii) lysosomes (Rab 7) and the nucleus. In addition, endocytosis inhibition studies were performed to understand and compare polyplex internalization and trafficking.


