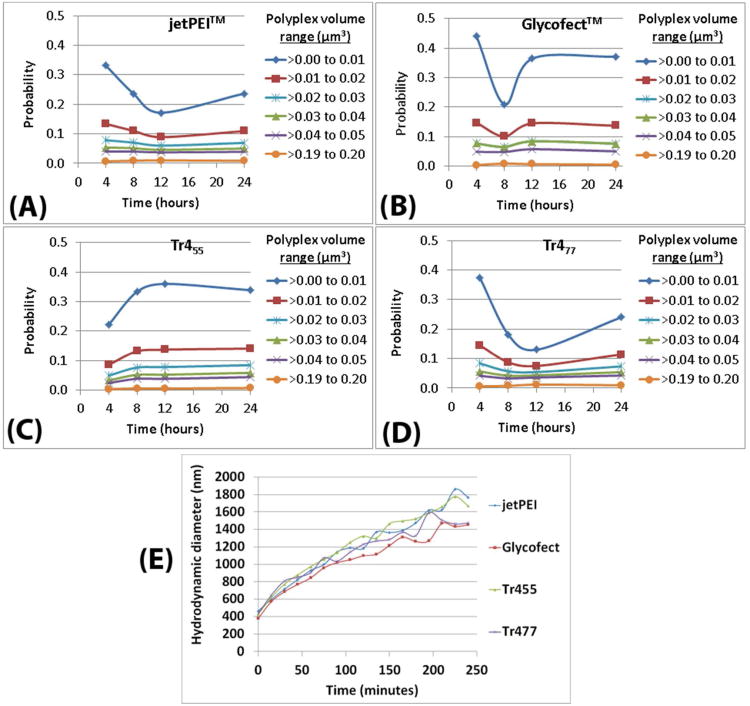
Figure 2.
Polyplex volume data in HeLa cells as a function of time, polymer type, and condition (A-D). The size ranges of polyplexes in 3D in a cell was determined as a function of polyplex volume and time. The compiled data has been displayed as the extrapolated probability values for the number of polyplexes to exist in the cell within the indicated volumes at ∼0.01, ∼0.02, ∼0.03, ∼0.04, ∼0.05, and ∼0.20 μm3, as shown in Table S7A. The probability was calculated by dividing the total number of polyplexes in each volume-range (for each polymer; at each time point; within six separate cells) by the total number of polyplexes (for each polymer; at each time point; within six separate cells). (E) Hydrodynamic diameter (y-axis on left) at different time points for all four polymers in reduced serum media OptiMEM at 37 °C with pH ∼7.3.

