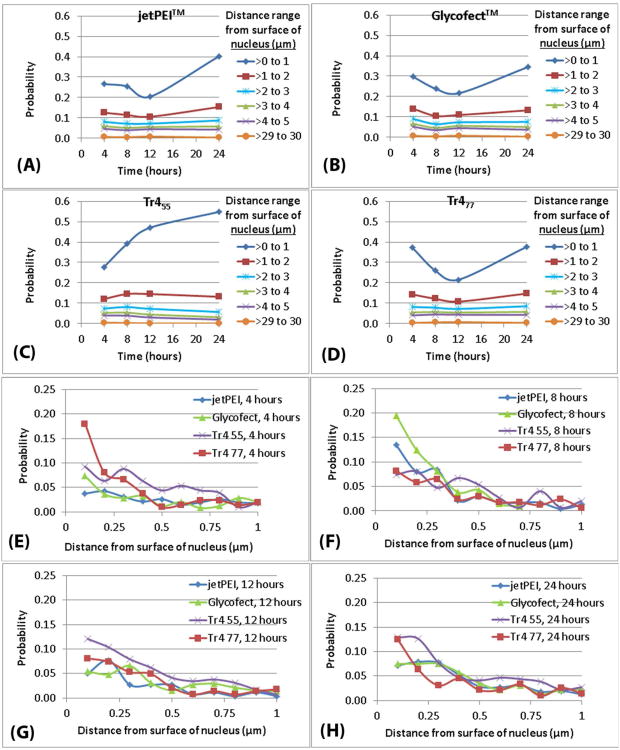
Figure 5.
(A-D) Probability values for the number of polyplexes to exist at the indicated distance range from the surface of the nucleus. (E-H) Probability values for the number of polyplexes to exist at a distance below 1 μm from the surface of the nucleus. The raw data to a distance of 1 μm was analyzed at 0.1 μm increments. All probability values in A-H were calculated by dividing the total number of polyplexes in each bin or distance-range (for each polymer; at each time point; in six cells) by the total number of polyplexes (for each polymer; at each time point; in six cells) and were extrapolated from the power law fit equations (Table S7B).

