Figure 7.
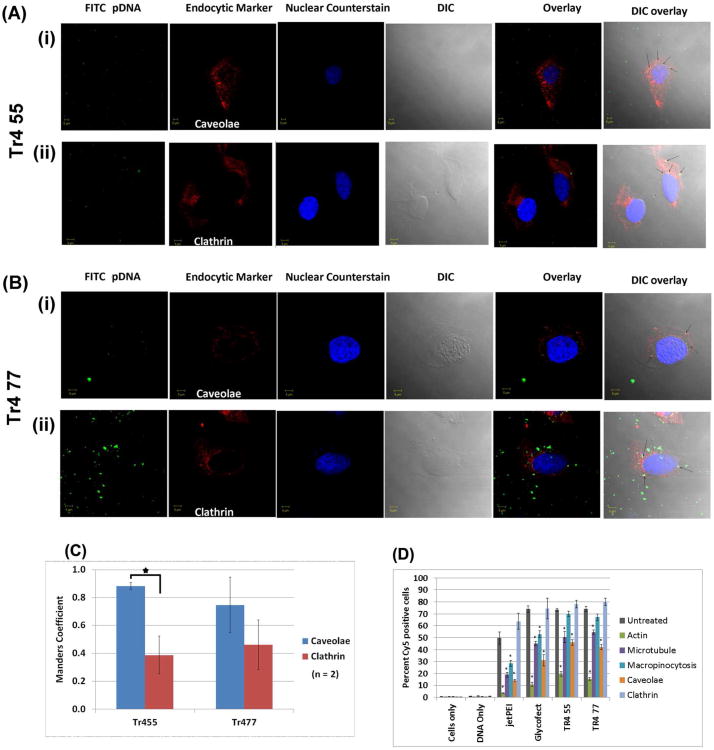
(A-B) Confocal images showing colocalization of Tr455 and Tr477 polymer containing polyplexes with clathrin and caveolae in HeLa cells. The experiment was performed as reported previously for Glycofect™.6 (C) Manders coefficient for colocalization of polyplexes (pseudo colored ‘green’) with clathrin (marker for clathrin heavy chain) and caveolae (marker for caveolin-1) (pseudo colored ‘red’) using ImageJ (n = 2 cells). The higher Manders coefficient of 0.8 indicates higher colocalization of polyplexes with either clathrin or caveolae; whereas the lower values of 0.4 indicate partial colocalization; (D) Pharmacological inhibition of polyplex internalization pathway (polyplexes were formed with Cy5-pDNA and the indicated polymer). The values on the y-axis denote the percent Cy5 positive cells. Actin was inhibited by cytochalasin D6 (green bars; 2 μg/mL for 15 minutes), microtubules were depolymerized with nocodazole (violet bars; 0.006 μg/μL for 30 minutes), macropinocytosis was inhibited by dimethylamiloride (turquoise bars; 100 μM for 5 minutes), caveolae was inhibited by filipin III (orange bars; 1 μg/mL for 1 hour), and clathrin was inhibited by chlorpromazine (light blue bars; 5 μg/mL for 30 minutes). Note: The ‘untreated’ (grey bars) controls represent an average of values from two different experiments. Note: ‘*’ indicates significant differences as compared to cells only at an alpha value of 0.05.

