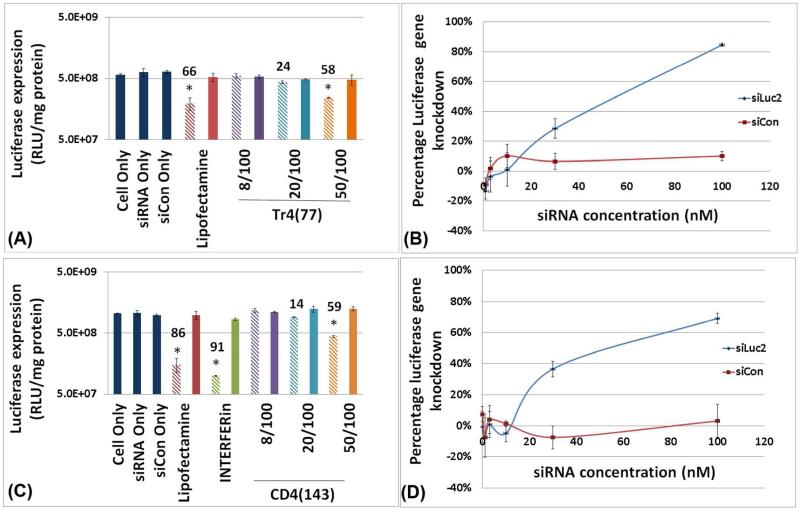
Figure 5.
Influence of siRNA concentration and N/P ratio on polyplex-induced target gene (luciferase) down-regulation in U-87_luc2 glioblastoma cells. Notation is as follows: hashed bar (lighter color) indicates treatment with polyplexes containing siRNA and the solid bar (darker color) indicates treatment with polyplexes containing siCon. The numbers above the bars indicate percentage of gene down-regulation. The notation Tr4(77) 50/100 indicates that polyplexes were formulated with siRNA and Tr4(77) at an N/P ratio of 50 and with 100 nM siRNA concentration. “siLuc2” indicates anti-luciferase siRNA; “siCon” indicates scrambled siRNA negative control. (A) Knockdown efficiency response to polyplexes formed with Tr4(77) with 100 nM siRNA at differing N/P ratio, (B) Extent of knockdown response to Tr4(77) polyplexes formulated at an N/P ratio of 50 at siRNA concentrations from 1 nM to 100 nM. (C) Knockdown efficiency response to polyplexes formed with CD4(143) with 100 nM siRNA at differing N/P ratios, (D) Extent of knockdown response to CD4(143) formulated at an N/P ratio of 50 at siRNA concentrations from 1 nM to 100 nM. [Note: The “*” symbol indicates significantly different values as compared to ‘cells only’ control (p<0.05)].

