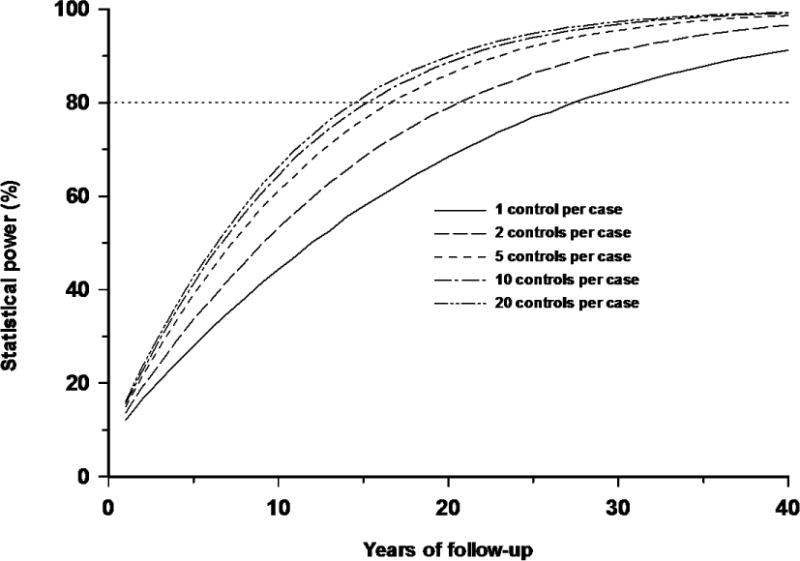
Figure 2.

Influence of numbers of controls per case in a case-control study, all as a function of years of follow-up in a GB population. All five scenarios (1, 2, 5, 10, 20 controls per case) assume homogeneous EOR of 32.15 Sv−1, and a distributions for RBM doses as in Table A2, and case distribution per year in GB as in Table A4.
