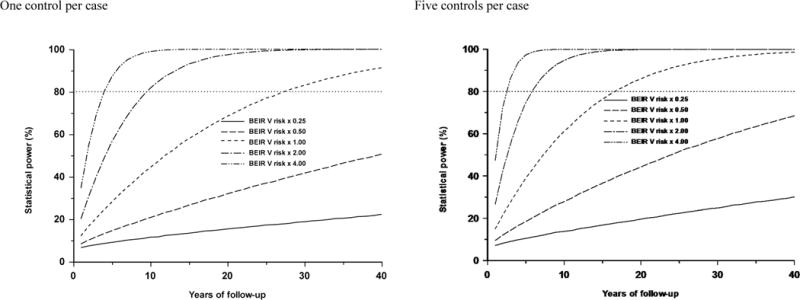
Figure 3.

Influence of size of excess relative risk coefficient on power in a case-control study, all as a function of years of follow-up in a GB population. All five pairs of scenarios (BEIR V × 0.25 (EOR=8.04 Sv−1), BEIR V × 0.50 (EOR=16.07 Sv−1), BEIR V × 1.00 (EOR=32.15 Sv− 1), BEIR V × 2.0 (EOR=64.29 Sv−1), BEIR V × 4.0 (EOR=128.59 Sv−1)) assume one or five controls per case, and a distributions for RBM doses as in Table A2, and case distribution per year in GB as in Table A4.
