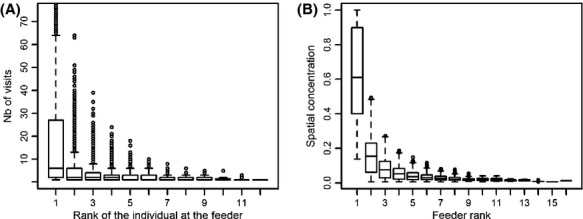
Figure 2.

Boxplots showing number of visits and spatial concentration of adult Ruby-throated Hummingbirds in Cleveland County, Quebec (Canada), 2007–2009. (A) For a given feeder on a given day, every individual has been ranked according to its number of visits at the feeder, with rank 1 being the individual with the most visits to the feeder. This figure shows how the number of visits at feeders decreased with the rank of individuals. For individuals of rank one, 427 points are over 75 visits (max = 188 visits) and are not shown on the figure. (B) For a given individual on a given day, every feeder has been ranked according to the number of visits made by the individual, with rank 1 being the most visited feeder. This figure shows the decrease in spatial concentration of individuals in relation to feeder rank. Both graphics are for the male versus males combination only.
