. 2014 Mar 26;6:ecurrents.outbreaks.a855a92f19db1d90ca955f5e908d6631. [Version 1] doi: 10.1371/currents.outbreaks.a855a92f19db1d90ca955f5e908d6631

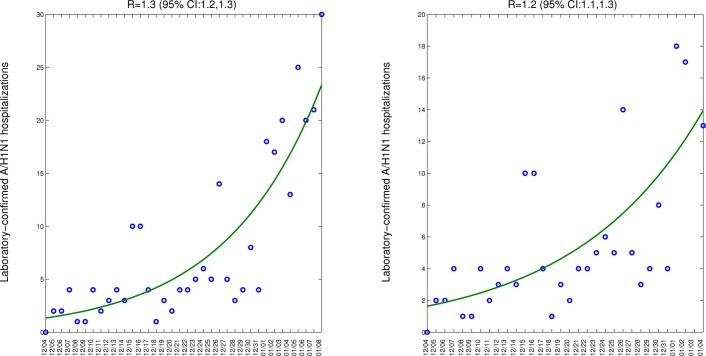
Model fits (solid line) obtained after fitting an exponential curve to the growth phase of the initial epidemic phase of the 2013-14 A/H1N1 epidemic to estimate the initial growth rate based on the case series of laboratory-confirmed A/H1N1 SARI A/H1N1 hospitalizations (left) and using a slightly shorter ascending phase as a sensitivity analysis (right).

Figure 4 Model fits (solid line) obtained after fitting an exponential curve to the growth phase of the initial epidemic phase of the 2013-14 A/H1N1 epidemic to estimate the initial growth rate based on the case series of laboratory-confirmed A/H1N1 SARI A/H1N1 hospitalizations (left) and using a slightly shorter ascending phase as a sensitivity analysis (right).