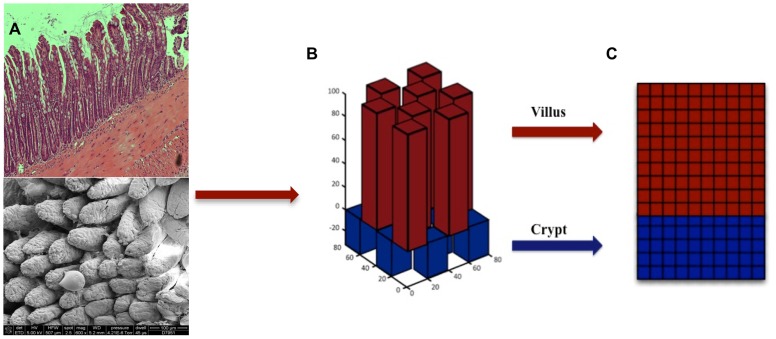
Figure 2. SEGMEnT topology.
Panel A contains a histology cross section of ileal tissue (top) and scanning electron microscopy of the mucosal surface of ileum (bottom). These images are juxtaposed with Panel B, which is the topology used by SEGMEnT where crypts and villi are represented with a matrix of rectangular prisms. Each individual crypt or villus is then “unwrapped” onto a 2-dimensional grid (Panel C), on which signaling interactions, morphogen diffusion and physical cellular actions take place.

