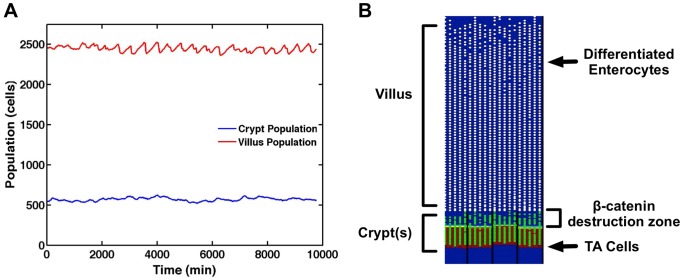
Figure 4. Baseline healthy ileal tissue dynamics.
Panel A demonstrates stable cell populations in the crypt and villus over time with complete renewal of the epithelial tissue every 5 days of simulated time. Panel B displays a SEGMEnT screenshot at homeostasis. Note that this 2d projection is the unwrapped 3d topology seen in Figure 2. All subsequent SEGMEnT screenshots are presented in this fashion to aid in the interpretation of its behavior, but are simulated in a 3d model. Differentiating GECs in the crypts are seen as green circles; white circles represent differentiated GECs on the villi. The red shading in the background represents areas of Wingless-related integration site (Wnt) activity; the absence of Wnt is seen as a blue background. Note that at the crypt-villus junction there is a region of undifferentiated GECs with no Wnt. Since activated Wnt signaling is identified and localized by the accumulation of β-catenin, the absence of Wnt in this zone denotes a region after the activation of β-catenin destruction complex and before all the β-catenin has been destroyed, at which point differentiation is triggered and occurs. This pattern of β-catenin activity is consistent with patterns seen in published histological data seen in Figures 3a and 3c in Ref [33].

