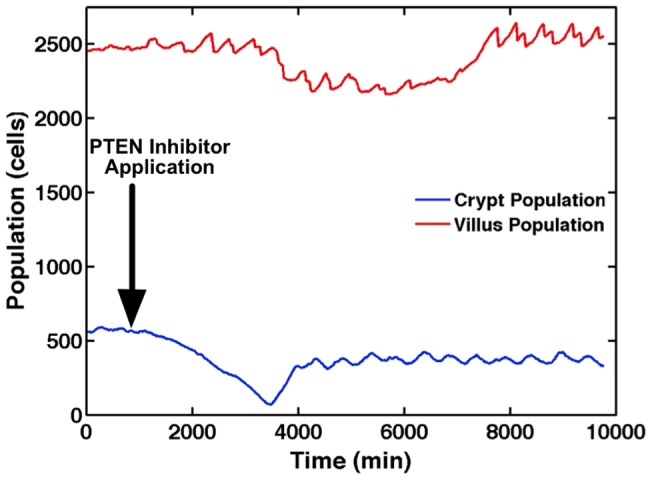
Figure 6. PTEN inhibition.

Average crypt and villus populations are presented when exposed to Phosphotase and tensin homolog (PTEN) inhibition. Immediately subsequent to the PTEN inhibition (Arrow), levels of Sonic Hedgehog Homolog (Hh) spike, resulting in an immediate shrinkage in the crypt. With Wingless-related integration site (Wnt) inhibited by the higher levels of Hh, cell proliferation slows, resulting in slight villus atrophy. The system then reaches a new equilibrium absent PTEN via these redundant pathways, resulting in essentially the baseline tissue architecture. It is notable that the compensatory dynamics seen in the simulation experiments occur in a period not captured by the sampling interval in [46].
