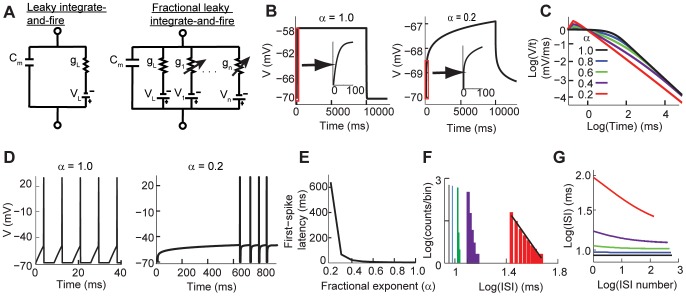
Figure 1. Comparison between the classical and fractional leaky integrate-and-fire models.
(A) Schematic circuit diagrams for the classical (left) and fractional order (right) leaky integrate-and-fire models. (B) Sub-threshold response in the classical (left) and fractional models (right). Both stimulated with  nA. (C) The sub-threshold voltage response converges to a power-law function when
  decreases. (D) While the classical model (left) generates regular spiking to a constant input, the fractional model (right) shows first spike latency and spike adaptation. Both models stimulated with
  nA. (E) The first-spike latency produced by the fractional model becomes longer when
  is smaller. (F) The inter-spike interval histogram as a function of
  . The histogram shows power-law distribution as
  . (G) The inter-spike intervals decrease over time as a function of
  . The color key in C applies to F and G.

