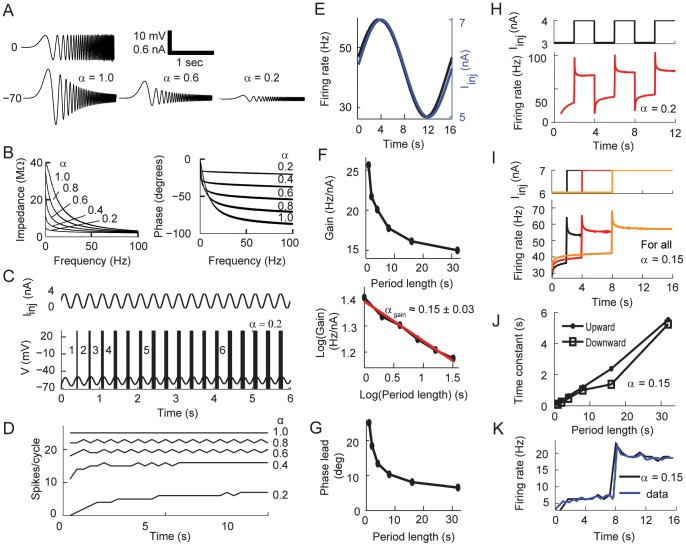
Figure 3. Sub-threshold and spiking fractional dynamics to oscillatory inputs.
(A–B) Voltage responses, impedances, and phase angles of the fractional order model in response to a ZAP current. (A) A time varying sub-threshold current input (Top) and the voltage responses for three different values of  (Bottom). (B) Impedance and phase analysis for the simulations in A as a function of
  . (C–D) Spiking response to just above threshold sinusoidal input (C, Top). The neuron generates an increasing number of spikes per cycle (C, Bottom). (D) The number of spikes per cycle for identical input as in C and varying
  . (E–G) Response to supra-threshold sinusoidal input. (E) The fractional model with
  instantaneous firing rate (black) in response to a sine wave input (blue). (F) The gain of the firing rate with respect to the period length of the input (Top) shows power-law dynamics when plotted in log-log (Bottom). The slope of the best-fit line (red) for the log-log gain curve is -
 . (G) The phase lead of the firing rate in response to the same sine wave current. (H–J) Response to square periodic input. (H) In response to square wave current (Top), the fractional model displays upward and downward spike rate adaptation for
  . (I) The instantaneous firing rate shows upward and downward adaptations in response to changes in the period of the square input (4, 8 and 16 s). (J) The time constants of both upward and downward adaptations in (I) increase when the period of the alternating input current increases. (K) The spike rate adaptation of L2/3 neocortical pyramidal neurons with period 16 s (Fig. 1C in [37]) is fitted with the spike rate adaptation of the fractional model with
  (95% confidence interval) using least-squares fitting. The alternating input current is switched between 3.4 and 4 nA. For E–K we used
  ms and
  ms to better replicate the experimental data.

