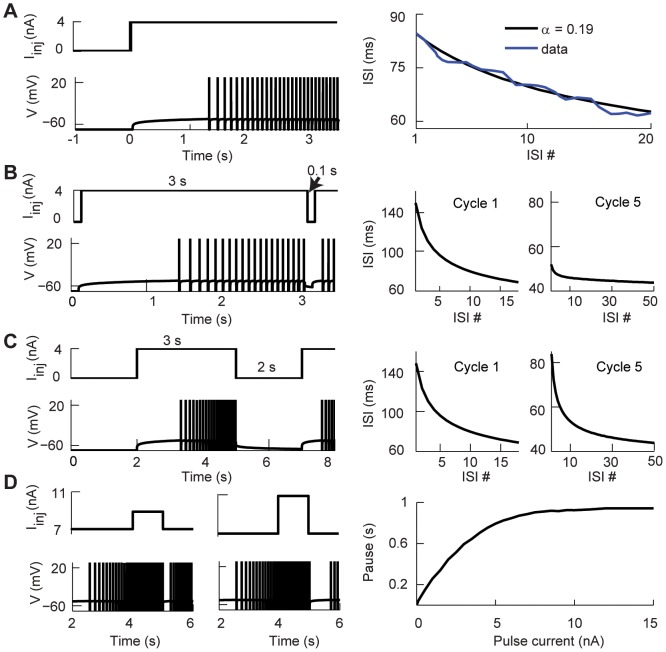
Figure 4. Inter-spike interval adaptation and history dependence.
(A) Left: The spiking activity of the fractional model with a step current of 4 nA. Right: The inter-spike interval (ISI) curve of Layer 5 pyramidal neurons in primary motor cortex (Fig. 2B in [38]) is fitted with the ISI curve of the fractional model with  (95% confidence interval with a least-squares fit). The first 7 ISIs of the model are removed for best fit. (B–C) Modeling the intrinsic memory of adapting pyramidal cells. (B) Left: The voltage trace of the model in response to a step current separated by 0.1 s inter-stimulus interval. Right: The ISIs of Cycle 1 and 5 as a function of ISI number. (C) The same as panel B, but with longer inter-stimulus interval, 2 s. For A–C
  . (D) Memory induced pauses of the model with
  depend on the magnitude of the current pulse. Left: Voltage traces with shorter and longer pauses in response to 1 nA and 4 nA current pulses, respectively. Right: The pause of the spiking activity increases as a function of the magnitude of the current pulse. For all we used
  ms and
  ms to better replicate the experimental data.

