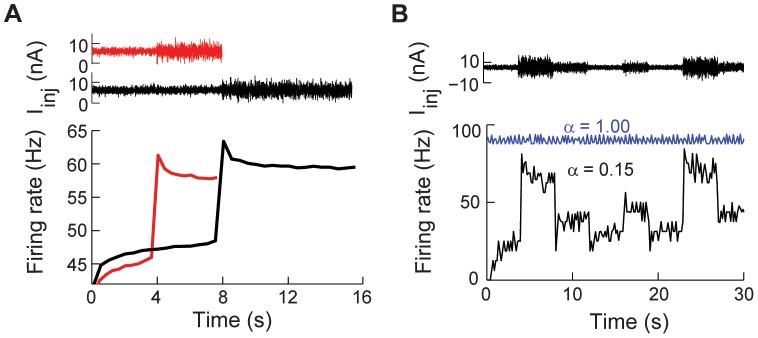
Figure 5. Firing rate adaptation to changes in input variance.

(A) Top: Noisy input current with two standard deviations:  6+
6+ nA,
nA,  = 1 or 2 nA. Bottom: The firing rate to noisy input current calculated from 100 trials,
  . (B) Top: Time varying noisy input current.
  5+
5+ nA,
nA,  = 1, 4, 2, 1, 2, 1, 4 and 2 nA, consecutively, and the noise
  is filtered with an alpha function
  with
with  ms. Bottom: Instantaneous firing rate in response to the input current for
  (blue) and
  (black). For both
  ms and
  ms.
ms.
