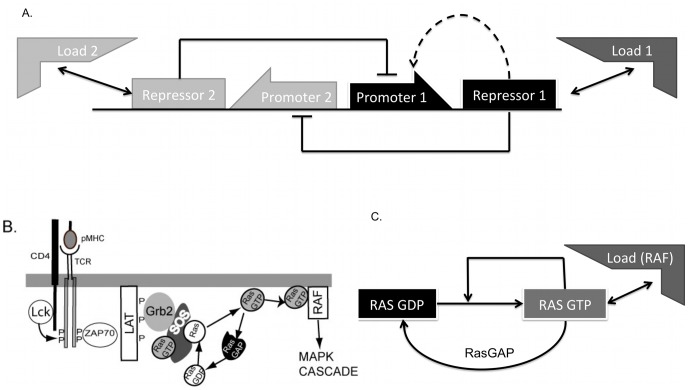
Figure 1. Schematic diagram of the circuits studied in this paper.
(A). The basic toggle switch is the network shown without the dotted line. Repressor 1 represses the production of Repressor 2 and vice versa. The dotted line denotes a positive feedback motif found in some natural circuits. (B). A cartoon of part of the MAPK activation pathway in T lymphocytes, adapted from [29], showing the role of Ras activation. Signals from peptide-MHC complexes are received at the TCR and lead to phosphorylation of the cytoplasmic chains of the TCR by the Src kinase, Lck. This recruits the kinase ZAP70 which trans-autoactivates and phosphorylates a scaffold called LAT, which recruits Grb2 and SOS to the plasma membrane. SOS activates Ras as as shown. (C) A simplified model of the Ras switch. RasGDP transforms into RasGTP via the enzyme SOS. However the catalytic rate of SOS increases when bound to RasGTP. This sets up an autocatalytic positive feedback. RasGTP is deactivated by enzymes called RasGAP's (among others).

