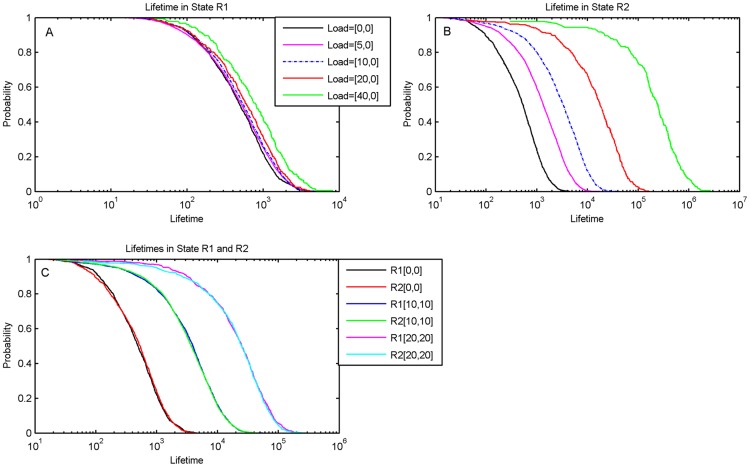
Figure 7. Distribution of the lifetimes of the toggle switch with and without loads.
The time the system spent in either state R1 or state R2 was calculated from the time trace of the stochastic simulations and a histogram made of the results. The histogram is shown on a semi-log plot to accommodate the data on a single chart. (A). Lifetimes in State R1. The unloaded state is the solid curve that is to the extreme left of the others, showing that the lifetimes in state R1 increase slightly on addition of load on R1 alone due to the “same side effect”. (B) Lifetimes in State R2 when load is on R1. The solid curve on the extreme left is the unloaded state. There is a significant increase in lifetimes due to the “opposite-side effect” of the load on R1. (C). Lifetimes with a balanced load, showing that both the states R1 and R2 get stabilized with a significant increase in lifetimes on addition of a small load on both sides. Note that the distributions for R1 and R2 for equivalent cases coincide as should be expected.

