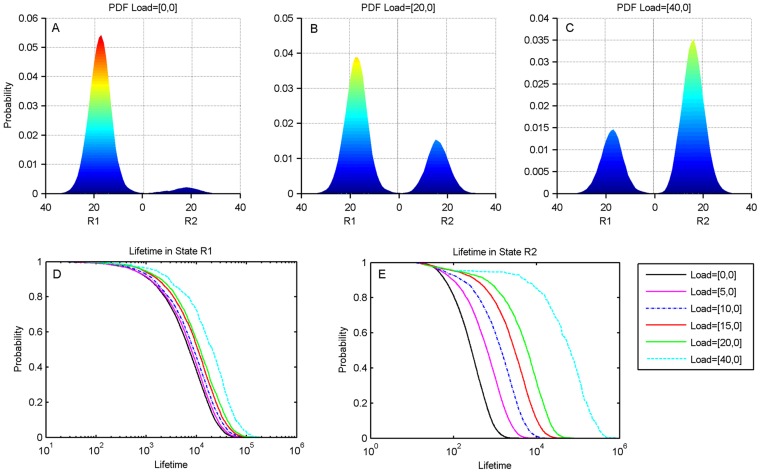
Figure 8. The genetic toggle switch with a positive feedback motif on Repressor 1 (R1).
(A). The probability distribution function (pdf) with no load. The positive feedback on Repressor 1 leads to a pdf skewed in favor of R1. (B). The pdf with a load of 20 molecules on R1 showing the increase in the weight of R2 due to the “opposite side effect”. (C). The pdf with a load of 40 molecules on R1. This load is more than enough to skew the pdf in favor of state R2. (D). Histogram of lifetimes in R1 with varying levels of load on R1. Comparison with panel A shows that the unloaded state has been stabilized by the positive feedback. Note that the lifetimes increase very slightly due to the “same side effect”. (E). Histogram of lifetimes in R2 with varying levels of load on R1. The unloaded case is the curve on the extreme left. Note the initial asymmetry in the lifetime distribution due to the positive feedback, as well as the large increase in lifetimes with the inclusion of a load.

