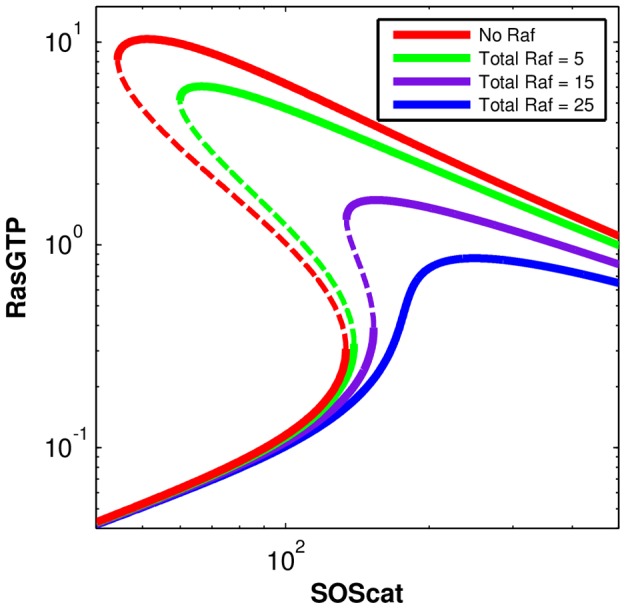
Figure 9. Bifurcation diagram of the Ras switch with different levels of Raf (load) on the system.

The total number of SOS in the simulation box is used as the parameter being tuned, which varies from 0 to 1000. For Raf = 0, Raf = 10 and Raf = 30, there are two bifurcations as SOS is increased. In the first bifurcation a new high valued stable steady state appears along with the low valued stable steady state. In the second bifurcation, the low valued stable state disappears leaving behind only the high valued state. The dotted line marks the unstable steady state that also comes into existence in the bistable region. As total Raf increases, the two bifurcations approach each other. When Raf = 50, the system has lost both of its bifurcations and is characterized by a single stable steady state at all values of Raf.
