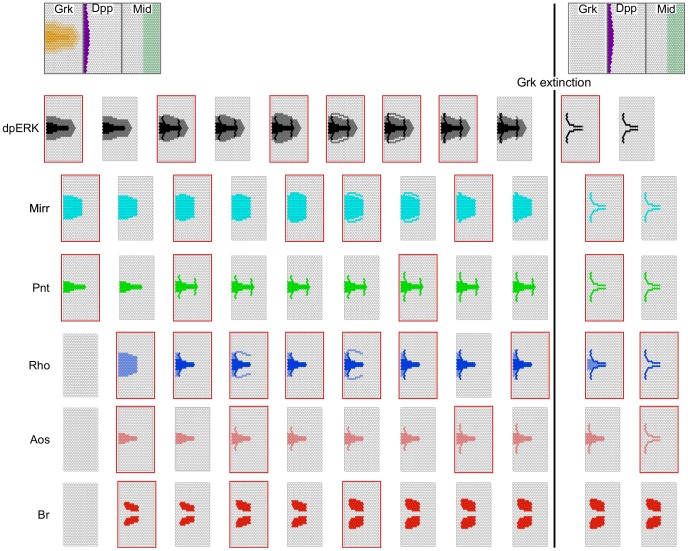
Figure 4. Mechanistic epithelial model, simulation.
The simulation starts with a naive configuration (i.e. all cells are undifferentiated) upon which Grk, Dpp, and Mid input levels are applied. All components are updated synchronously except dpERK and the integration variables (not shown), which are always updated earlier (see text). From left to right are depicted the successive states of each component in the epithelium (gene expression patterns), before Grk extinction. The right panels show the components' states after Grk extinction. Color intensities are used for multi-valued components (Grk, Rho and EGRF, see Figure 3B). Red frames denote pattern changes.

