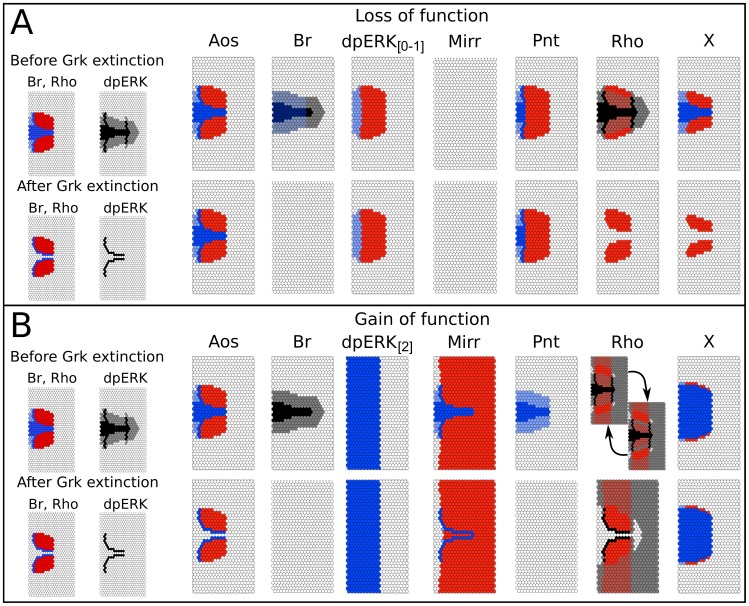
Figure 7. Mechanistic epithelium model.
(A) Loss-of-function and (B) Gain-of-function analyses. Wild type patterns are shown on the left for comparison. Each of the boxes shows the resulting patterns of Br and Rho or dpERK, under gain-of-function or loss-of-function situations for multiple elements (corresponding to genes) of the model. The outcomes are shown both before and after Grk extinction on the top and lower rows of each panel, respectively. In the case of Rho GOF (for which the level is constrained between levels 1 and 2), a cyclic attractor is reached before Grk extinction, which resolves into a stable state afterwards (see text).

