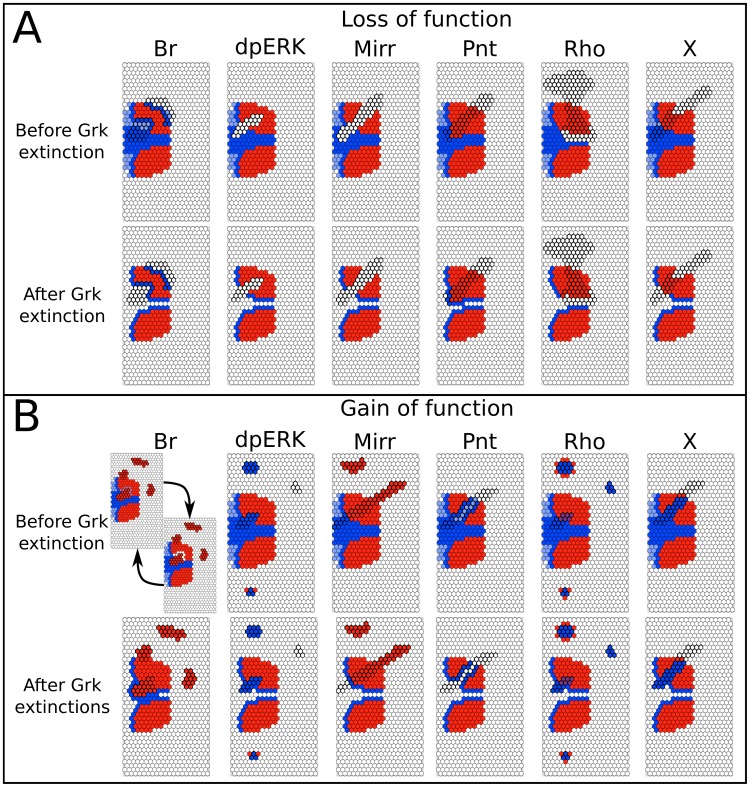
Figure 8. Mechanistic epithelium model, clonal analyses.
(A) Loss-of-function clones. (B) Gain-of-function clones. Before Grk extinction (top row) and after Grk extinction (lower row). Row organization and color codes as in Figure 7. In the Br GOF case, the oscillatory attractor obtained before Grk extinction is due to the synchronous simulation scheme (see text). Here, we show the most consistent pattern of the two stable states resulting from the Grk removal.

