
Figure 2. Existing predictions for silent-site diversity break down in the interference selection regime.
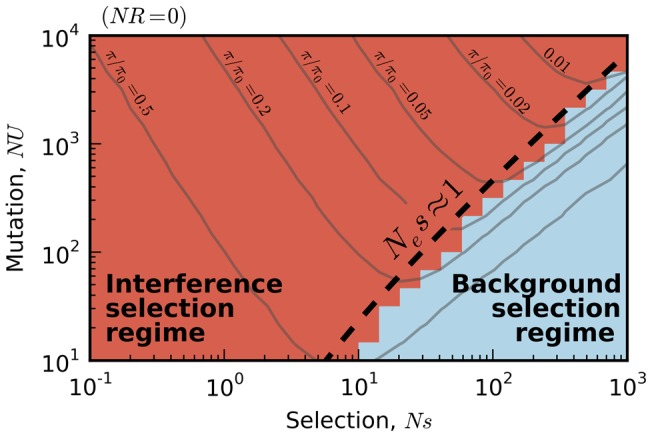
Blue tiles denote populations where the pairwise diversity π falls within 50% of the background selection prediction in Eq. (2), and red tiles denote populations that deviate by more than 50%. For comparison, the solid black line depicts the set of populations with  , which is close to the point where Muller's ratchet begins to click more frequently [41].