
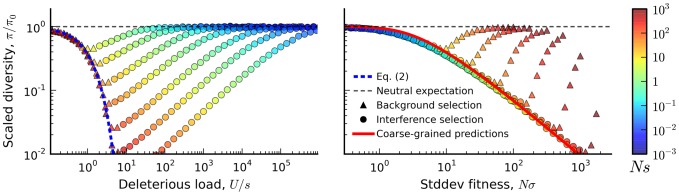
Figure 3. The average reduction in silent site diversity relative to the neutral expectation.
Colored points are measured from forward-time simulations of the simple purifying selection scenario in Figure 2 for  and
and  . Triangles and circles distinguish populations that are classified into the “background selection” and “interference selection” regimes, respectively (see Methods). In the left panel, these results are plotted as a function of the deleterious load
  , and the background selection prediction from Eq. (2) is given by the dashed line. The right panel shows the same set of results plotted as a function of the observed standard deviation in fitness, and the solid line denotes the “coarse-grained” predictions (see Methods). Note that for populations in the background selection regime (triangles),
  is determined primarily by the deleterious load, independent of Ns and NU. For populations in the interference selection regime (circles),
  is determined primarily by the standard deviation in fitness.