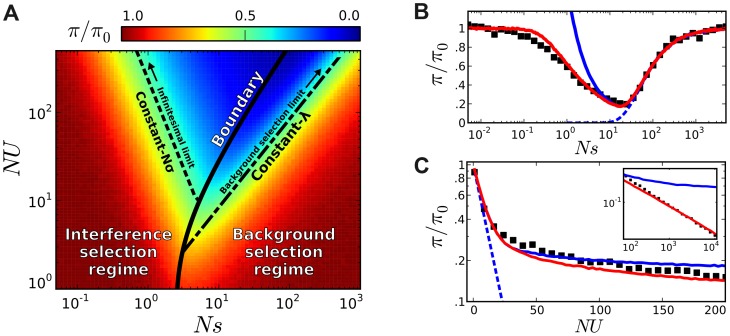
Figure 5. Coarse-grained predictions for the reduction in pairwise diversity.
(A) The solid black line denotes the boundary separating the interference and background selection regimes, while the dashed lines to the left and right denote lines of constant Nσ and lines of constant λ, respectively. (B) A “slice” of this phase plot for constant NU = 50. The black squares denote the results of forward-time simulations and our coarse-grained predictions are shown in solid red. For comparison, the original structured coalescent is shown in solid blue, while the dashed line gives the prediction from the background selection limit in Eq. (2). (C) A similar “slice” of this phase plot for constant Ns = 10, with inset extended on a log-log scale. As  , we approach the asymptotic limit
  from Ref. [44].

