
Figure 6. The silent site frequency spectrum from Figure 4 (red dots) and forward-time simulations of three equivalent populations predicted from our coarse-grained theory.
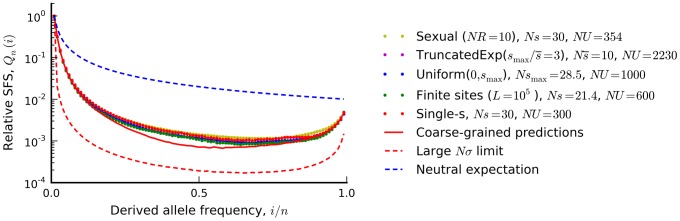
a recombining population (yellow), a finite chromosome with L = 105 sites that allows for beneficial as well as deleterious mutations (green), a population with a uniform distribution of deleterious fitness effects (blue), and a population with an exponential distribution of deleterious effects, truncated at  . Our coarse-grained predictions are shown in solid red. For comparison, the dashed blue lines show the neutral expectation, while the dashed red lines show the large Nσ limit from Ref. [44] (Nσ≈90 in the examples above). To enable better visual comparison, each frequency spectrum is normalized by the number of singletons it contains.