
Figure 8. Relation between diversity and recombination rate in the presence of interference.
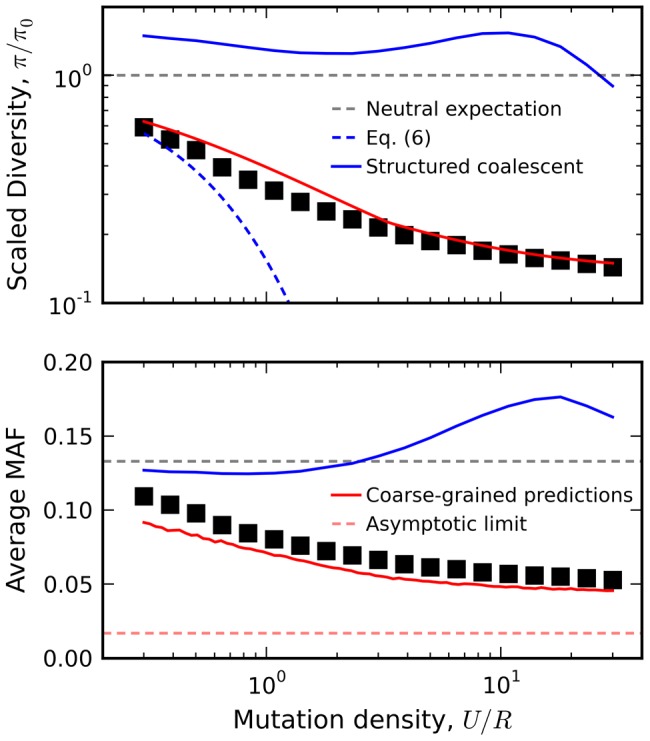
Black squares denote the results of forward time simulations for fixed Ns = 10 and NU = 300, with recombination rates varied from NR = 10 to NR = 103. Our coarse-grained predictions are shown in solid red. For comparison, we have also included predictions from the background selection limit in Eq. (6) (blue dashes) as well as the recombinant structured coalescent predictions from Ref. [42] (solid blue) and the asymptotic limit from Ref. [73] (red dashes).