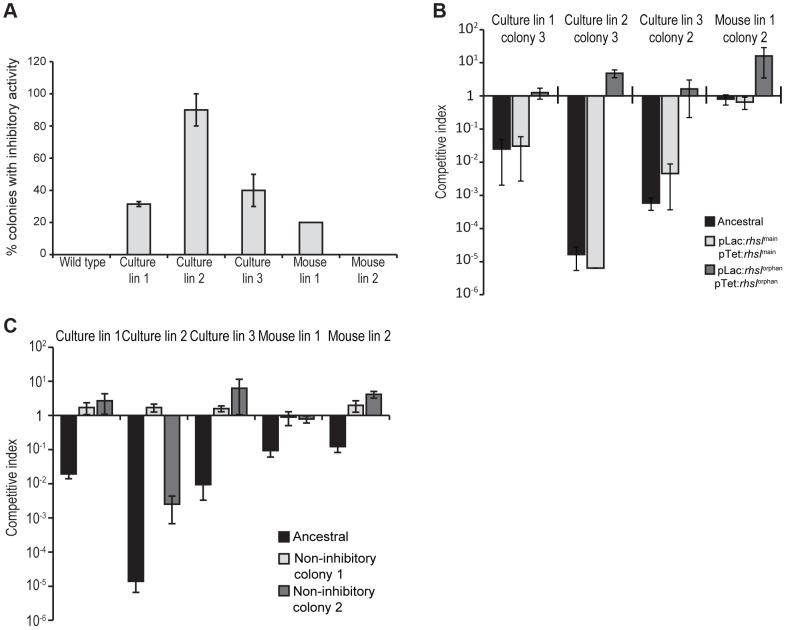
Figure 5. A subpopulation of evolved cells has growth inhibition activity.
A) Two sets of independent clones were isolated twice from the evolved lineages and tested for growth inhibition activity against ancestral cells. The percentage of evolved clones with inhibition activity is shown. Reported values represent the mean ± SEM for at least two independent experiments. B) Growth inhibition activity of isolated evolved clones. Clones from each evolved lineage were competed against ancestral cells (black bars), ancestral cells overexpressing rhsImain (light grey bars) and ancestral cells overexpressing rhsIorphan (white bars). Reported values represent the mean ± SEM for at least three independent experiments. C) Growth inhibition activity of evolved lineages towards non-inhibitory clones. Evolved lineages were co-cultured with ancestral cells (black bars) and two non-inhibitory clones isolated from the evolved cultures (light grey and white bars). Competitive indices represent the mean ± SEM for at least three independent experiments.

