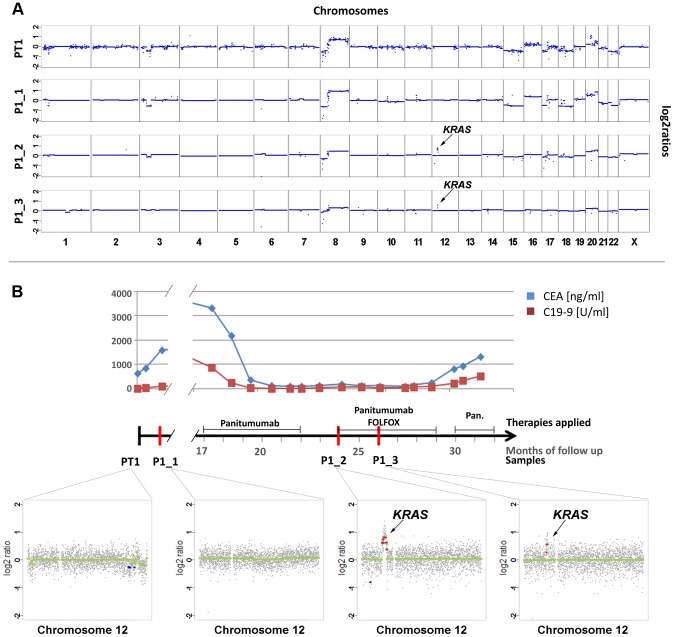
Figure 1. Emergence of KRAS amplification during panitumumab therapy in patient #1.
(a) Copy number analyses of the primary tumor (PT1) and three plasma samples (annotated as P1_1, P1_2, P1_3). The dates of plasma sampling are shown in (b). The X- and Y-axes indicate the chromosome and the log2-ratios, respectively. The location of KRAS is indicated for plasma samples P1_2 and P1_3. (b) The units on the timeline in the center are in months, the dates of our blood collections are indicated by red bars. Above the time line the timing of anti-EGFR therapy and the CEA (ng/ml) and CA 19-9 (U/ml) levels (in blue and red lines, respectively) are illustrated. Below the timeline are zoomed in log2-ratio plots of chromosome 12 (PT1, month 0; P1_1, month 1; P1_2, month 24; and P1_3, month 26). Segments with identical log2-ratios whose log2-ratios is <0.2 are depicted with blue dots, segments with identical log2-ratios and log2-ratios >−0.2 in red dots, and segments with log2-ratios between −0.2 and 0.2 in green. (FOLFOX: FOL-Folinic acid (leucovorin) + F-Fluorouracil (5-FU) + OX-Oxaliplatin (Eloxatin); Pan.: Panitumumab).

