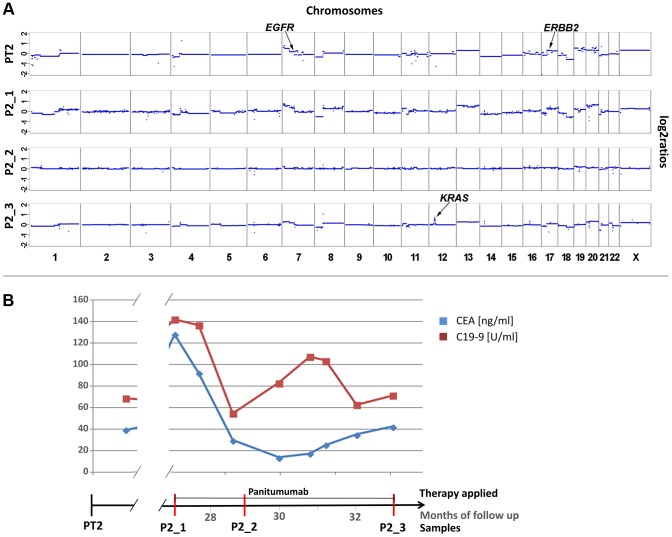
Figure 2. Appearance of KRAS amplification after 6 months of panitumumab therapy in patient #2.
(a) Copy number analyses of the primary tumor (PT2) and three plasma analyses (P2_1, month 27; P2_2, month 29; and P2_3, month 33). The locations of the EGFR, ERBB2 and KRAS genes are indicted in PT2 and P2_3, respectively. The dates of plasma sampling are shown in (b). (b) The timeline indicates the dates of our blood collections (red bars), the duration of the panitumumab therapy, and the respective CEA (ng/ml) and CA 19-9 (U/ml) (in blue and red, respectively) values.

